The static characteristics of diode I 補足
How to draw a scatter plot
Select data and insert a "scatter plot" as Fig.1.
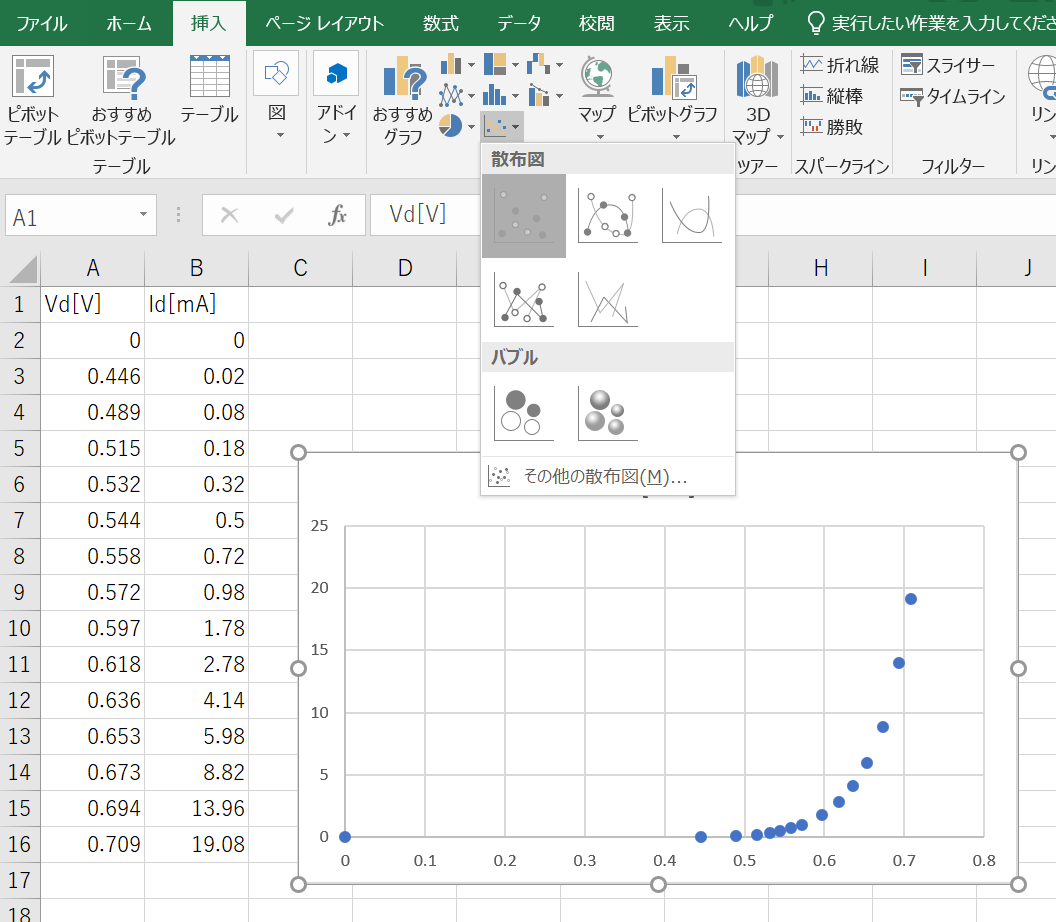
Fig. 1. Scatter plot.
Improve the appearance of the graph.
- Erase the title.
- Add axis labels.
- Change the marker.
- Erase the outer frame of the graph.
- Draw tick marks inside the graph.
- Delete scale lines.
- Add a legend.
- Increase text size.
The improved graph is shown in Fig.2.
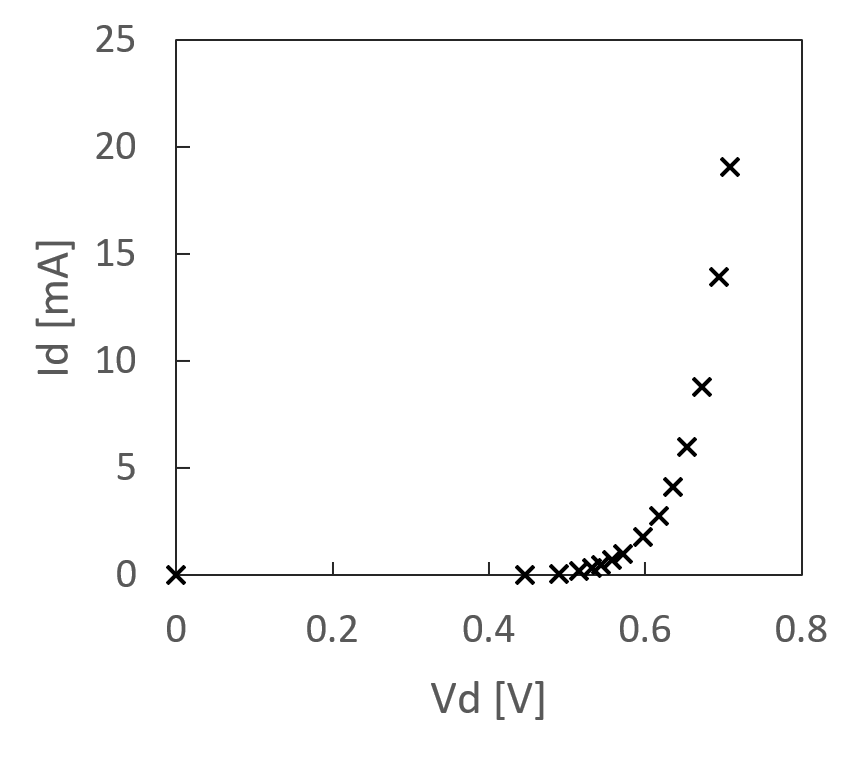
Fig. 2. Improved graph.
Interpolation line
Do not draw interpolation lines for experimental results.
Draw a line for the theoretical value obtained by the formula.
マイナス電源
安定化電源を使って回路に対してマイナスの電圧を印加したい場合、安定化電源のGNDとマイナス端子を短絡している金具を移動させ、GNDとプラス端子を短絡する。
実験が終わったら、GNDとマイナス端子を短絡させもとに戻す。